A graduate student in the Department of Political Science at the University of Chicago has launched an independent web platform designed to bring statistical structure to one of the most persistent ambiguities in modern political discourse: how to locate individuals on the political spectrum in a measurable, comparative way. The site, available at polimap.web.app, allows users to conduct political spectrum tests for themselves, simulate tests from the perspective of historical or contemporary figures, and collectively evaluate political positioning through a weighted voting mechanism. The platform has already catalogued the political spectra of hundreds of heads of state and intellectuals across dozens of countries.
The project seeks to address a recurring problem in political conversation: the widespread use of labels such as “left,” “right,” “authoritarian,” or “libertarian” without a transparent methodological basis. Rather than relying on anecdotal interpretation or ideological shorthand, the platform introduces a structured, two-axis coordinate model and aggregates user assessments to produce statistically weighted results.
A Two-Axis Political Model
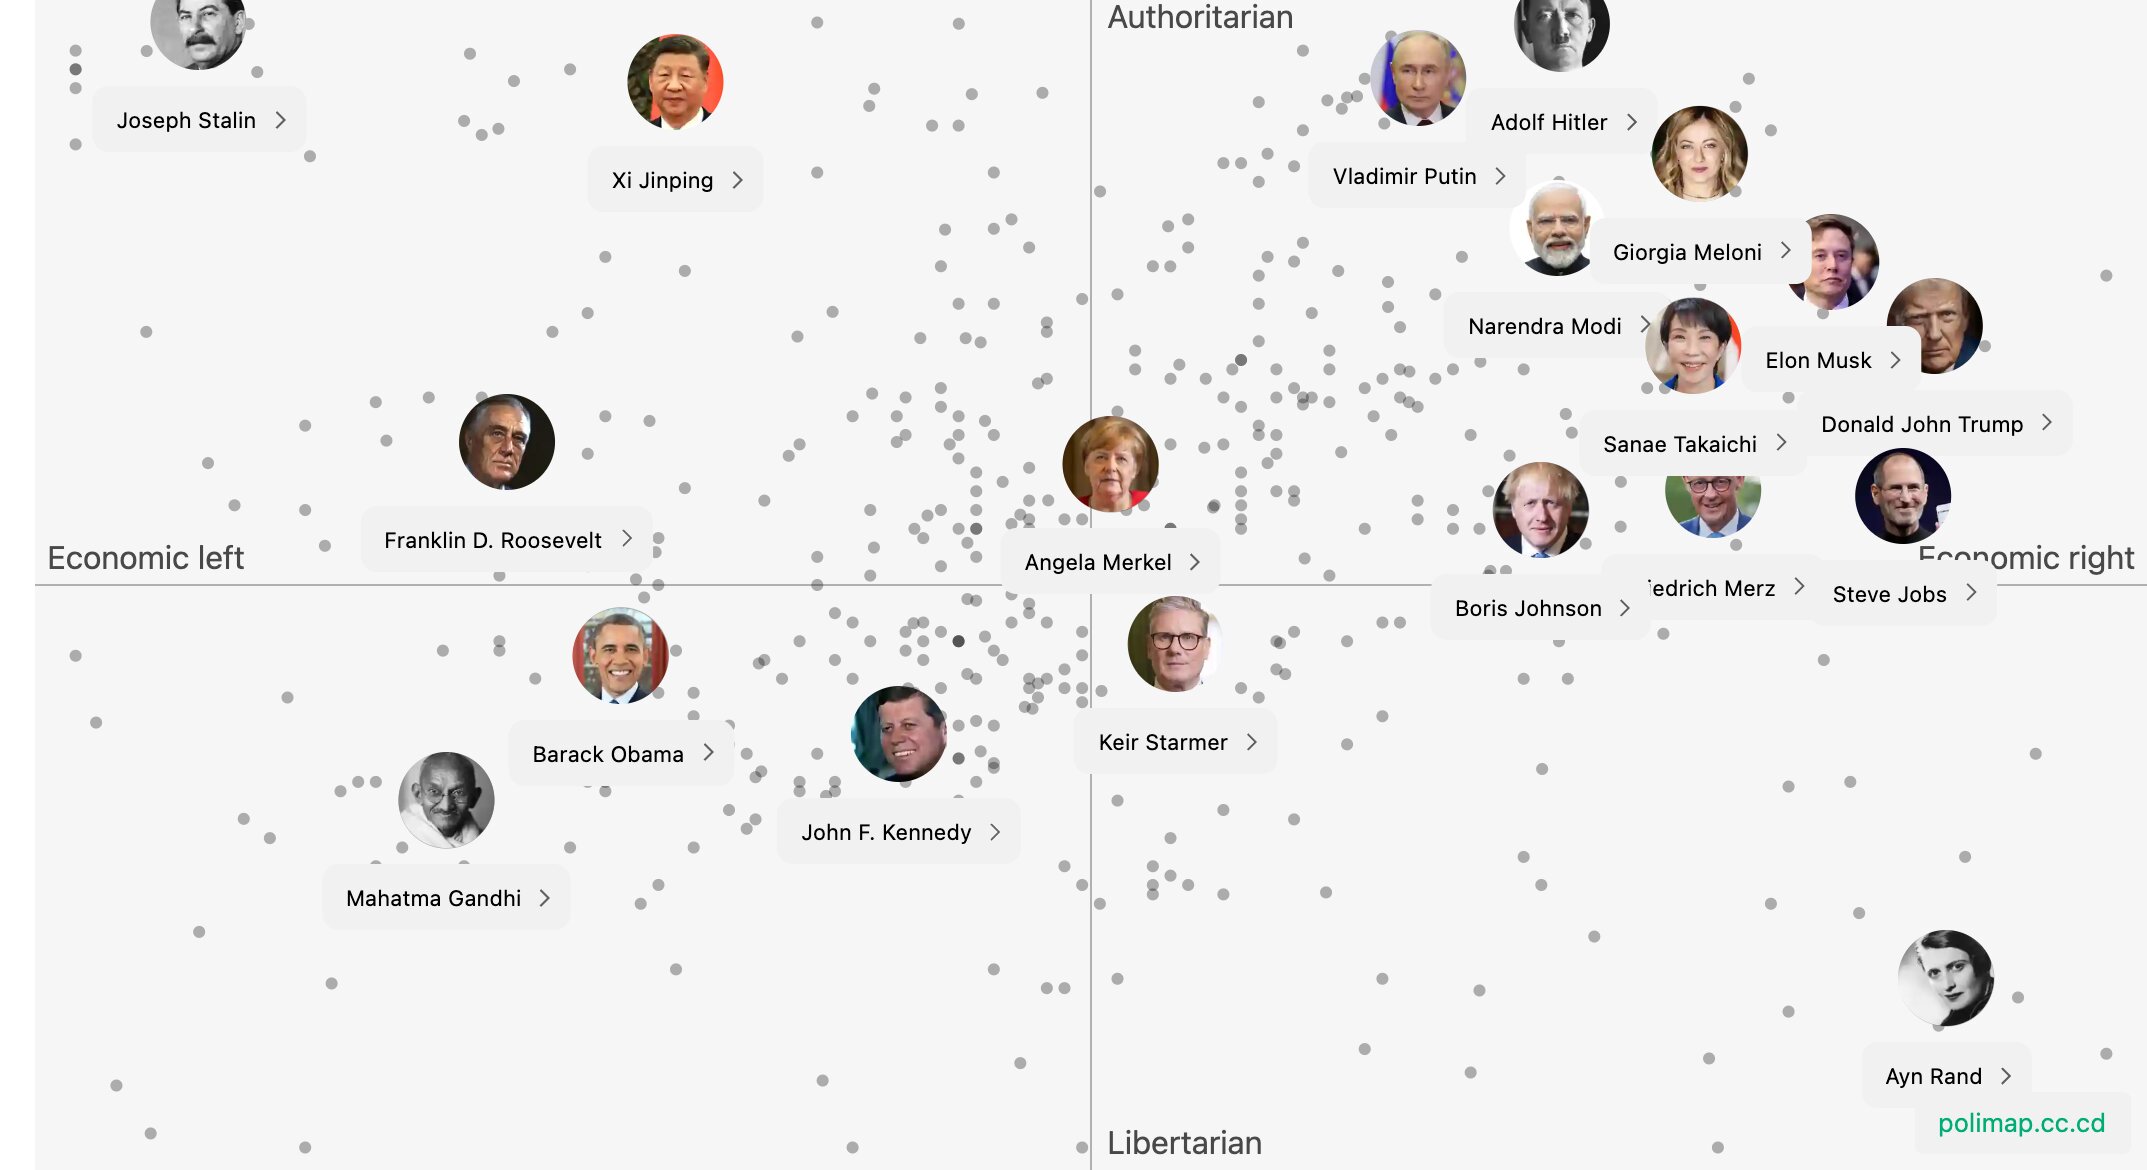
At the core of the website is a political mapping framework based on two primary dimensions: a Social Axis (Authority–Liberty) and an Economic Axis (Economic Left–Economic Right). Each axis ranges from 0 to 100. A score of 0 represents the lowest degree on that dimension, while 100 represents the most extreme position. The result is a two-dimensional coordinate system in which each individual—real or simulated—can be plotted, avoiding binary classification in favor of a continuous numerical field.
Self-Testing and Perspective Simulation
Users can complete a political spectrum questionnaire to determine their own position. The test consists of structured prompts covering governance, civil liberties, redistribution, markets, institutional authority, and related policy questions. Responses are translated into numerical scores along both axes.
Beyond self-assessment, the platform introduces a distinctive feature: perspective-based simulation. Users can create entries for historical or contemporary individuals and answer the same political spectrum test as if they were that person. The goal is not biographical speculation but analytical reconstruction—participants are encouraged to ground their answers in documented speeches, policy decisions, and ideological statements. This method transforms the platform from a personality quiz into a collaborative interpretive exercise.
Weighted Approval Mechanism
Each submitted record—whether self-assessment or simulation—can receive “likes” from other users. These likes function as a weighting mechanism: the more users approve a particular interpretation, the greater its statistical influence on the figure’s aggregated coordinate. Instead of a simple average, the system applies weighted scoring so that interpretations with broader community agreement exert greater influence over the final plotted position.
The platform does not eliminate disagreement; rather, it quantifies it. Divergent submissions remain visible, but their relative influence corresponds to the degree of endorsement they receive.
Comprehensive Archiving and Filtering
The website maintains a cumulative archive of all recorded figures. Users can browse and filter the political spectrum map by country, historical era, and profession. Each individual is displayed as a coordinate point on an interactive map divided into four quadrants: Authoritarian Left, Authoritarian Right, Libertarian Left, and Libertarian Right. Because the axes operate on continuous scales, individuals are not restricted to categorical quadrants—their exact numerical coordinates are visible.
Statistical Framing of Political Labels
The project’s stated aim is to provide a statistical foundation for ideological claims. When public discourse labels someone “left-wing” or “right-wing,” the platform asks: based on what? How many independent evaluators reach the same conclusion? What is the dispersion of opinion? By collecting multiple independent submissions and applying weighted aggregation, the system generates mean coordinate values, distribution patterns, and relative consensus levels—mirroring methods used in survey research and crowd-sourced estimation.
The graduate student behind the platform describes the project as an attempt to shift ideological labeling from rhetorical assertion to measurable claim. If a figure is categorized as economically right-leaning with a score of 78, that number represents a statistically derived output rather than a purely subjective statement.
Methodological Transparency
Unlike many online political quizzes, the platform emphasizes numerical transparency. Axis scales are clearly defined. The weighting mechanism is explicit. Each submission remains accessible for inspection. Users can review the number of submissions per figure and the degree of variation among them—large dispersion suggests ideological ambiguity or disagreement, while tight clustering suggests stronger interpretive consensus.
Educational and Research Implications
Although independently developed, the platform has potential educational value. Political science students frequently debate ideological classification without standardized reference points. A quantifiable mapping system offers a framework for structured discussion. The site may also serve as a pedagogical tool for introducing multidimensional ideology models, demonstrating crowd-sourced data aggregation, and exploring comparative political analysis. Because it allows historical simulation, it may also stimulate primary-source engagement—users who attempt to map a historical figure must consult documented positions to justify their answers.
Limitations and Interpretive Caution
The platform does not claim to produce definitive ideological truth. Its results are contingent upon user participation, interpretation quality, and sample size. Weighted voting mitigates but does not eliminate bias. Furthermore, political ideology cannot be fully reduced to two axes—cultural, religious, geopolitical, and institutional variables often complicate classification. Nevertheless, the project’s contribution lies in formalizing debate: rather than asserting ideological labels as self-evident, it treats them as empirical claims subject to aggregation and revision.
As participation grows, the statistical stability of mapped figures may increase, allowing the project to evolve from experimental prototype to substantive reference framework.